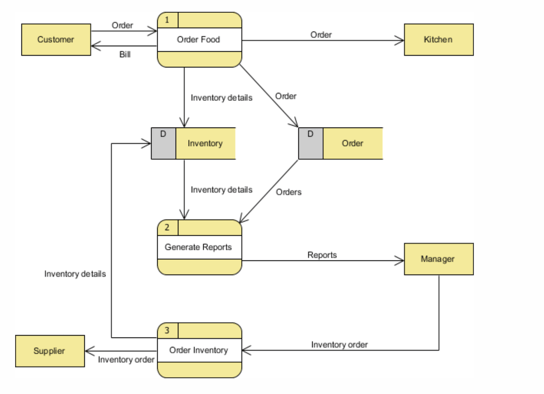
Above is a basic flow chart that will be used in the Indianapolis market. I think this is similar to all data integration from the other locations that are already up and running. Starting from the customer ordering food, to the order and inventory being directly used to generate reports for management, this continuous flow of data will help us generate reports on how well the restaurant is performing.
